End of fragmentation.
Beginning of control.
facilityUP transforms your property management into a unified, intelligent platform. Turn your real estate from static, physical assets into dynamic, strategic assets whose value is actively optimized in real time.
The facilityUP Platform
Six integrated modules covering the entire property management lifecycle
Facility Dashboard
Centralized overview of all KPIs, financial metrics, and operational data in real time
Facility Studio
Advanced tool for managing, configuring, and customizing the platform as needed
Performance Dashboard
Detailed performance analysis, benchmarking, and market comparison
Digital Intelligence
AI-powered insights, predictive analytics, and automated recommendations
EcosystemStore
Integration with external systems, API management, and third-party applications
Logs & Events
Comprehensive logging, audit trail, event management, and compliance reporting
facilityUP Quick Overview
Watch a short demo of the platform in action
Problem: Information Fragmentation
The traditional real estate market suffers from a fundamental flaw. Key data is scattered across separate, incompatible systems, creating risk and hindering effective decision-making.
Financial Data
Accounting Software
Tenant Data
Separate Platform
Operational KPIs
Custom Spreadsheets
Transformation Mission
The traditional real estate market suffers from a fundamental flaw: information fragmentation. Key data—financial, operational, and tenant data—is scattered across separate and incompatible systems.
This inefficiency is a direct driver of financial and operational risk. Our mission is to transform real estate professionals from passive asset managers into proactive value architects. We are creating a transformation that turns property management into a fully data-driven industry.
However, there is a way to break free from inefficiency and gain full control of your own digital assets.
Transformation
From Chaos to Complete Control
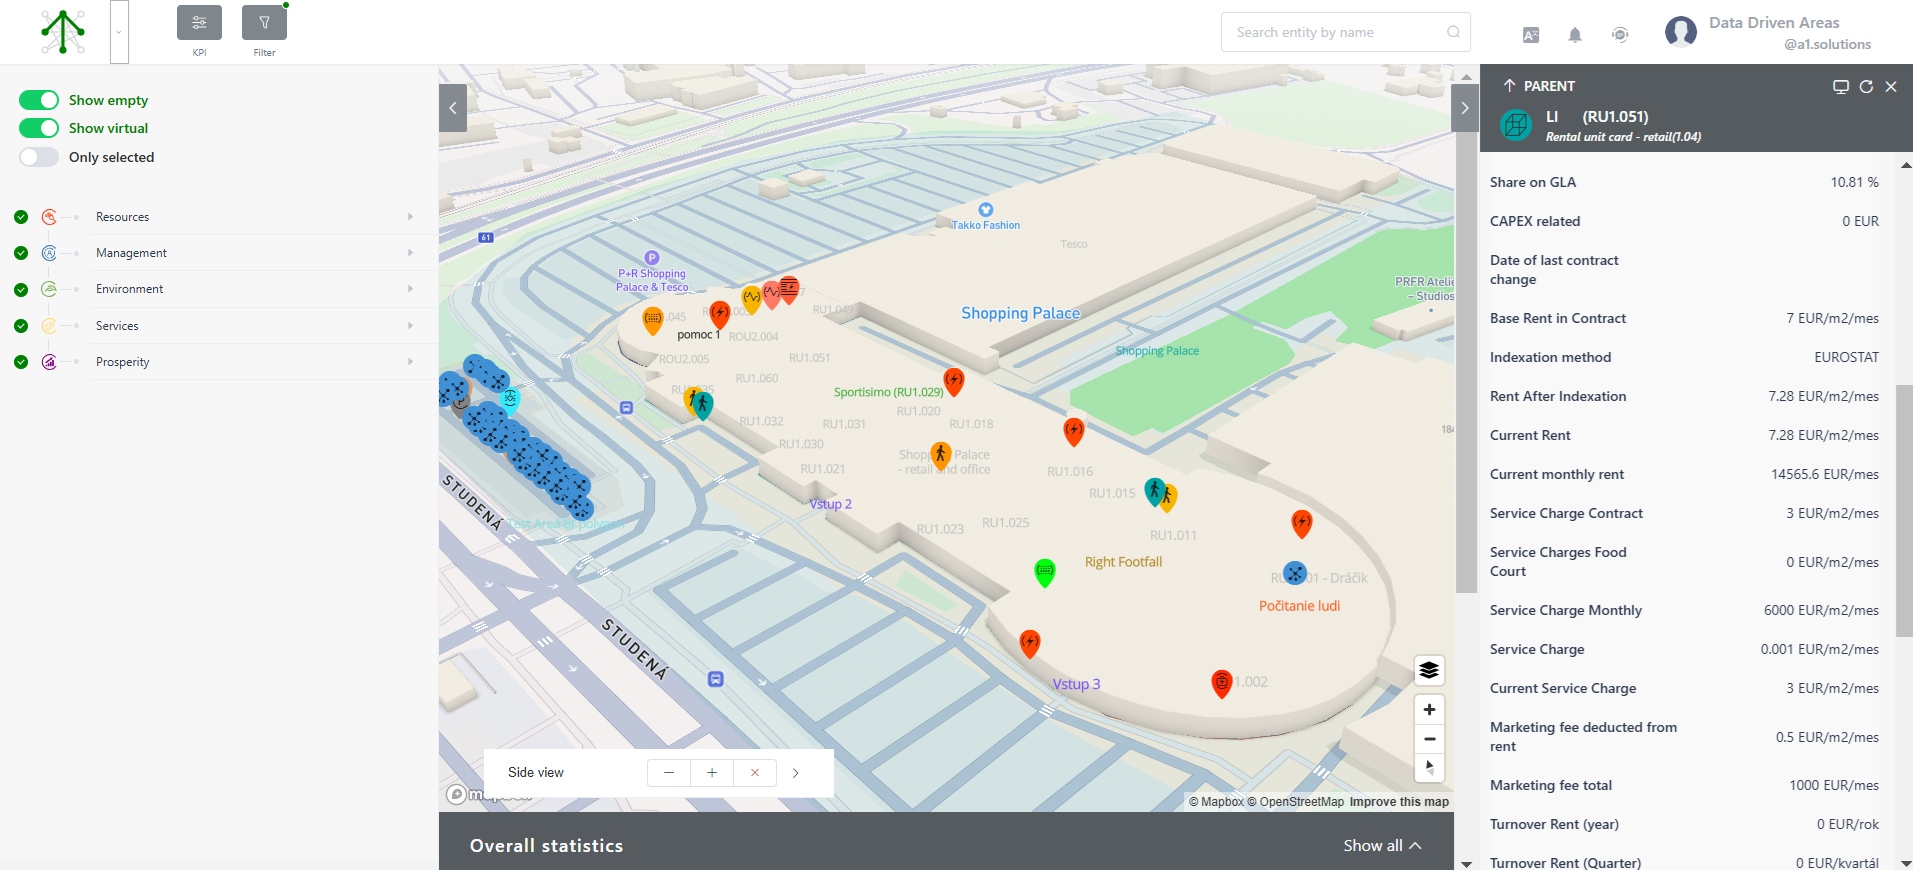
* Illustrative example — demo data for presentation purposes.
Before Transformation
After Transformation
Economics
Economic savings
Implementing the platform has a direct positive impact on EBITDA and Net Operating Income (NOI).
Simulation
Unit
Property data block kit
Click on any module below.
CAPEX Demo: Indicative Analysis of Shopping Palace
Capital expenditures (CAPEX) are a key part of property management. This interactive chart demonstrates a typical CAPEX budget structure. Click on the segments for details.
* Illustrative example — demo data for presentation purposes.
Category Overview
Select a category from the chart to view detailed information, including key performance indicators (KPIs) and cost optimization options using data analysis.
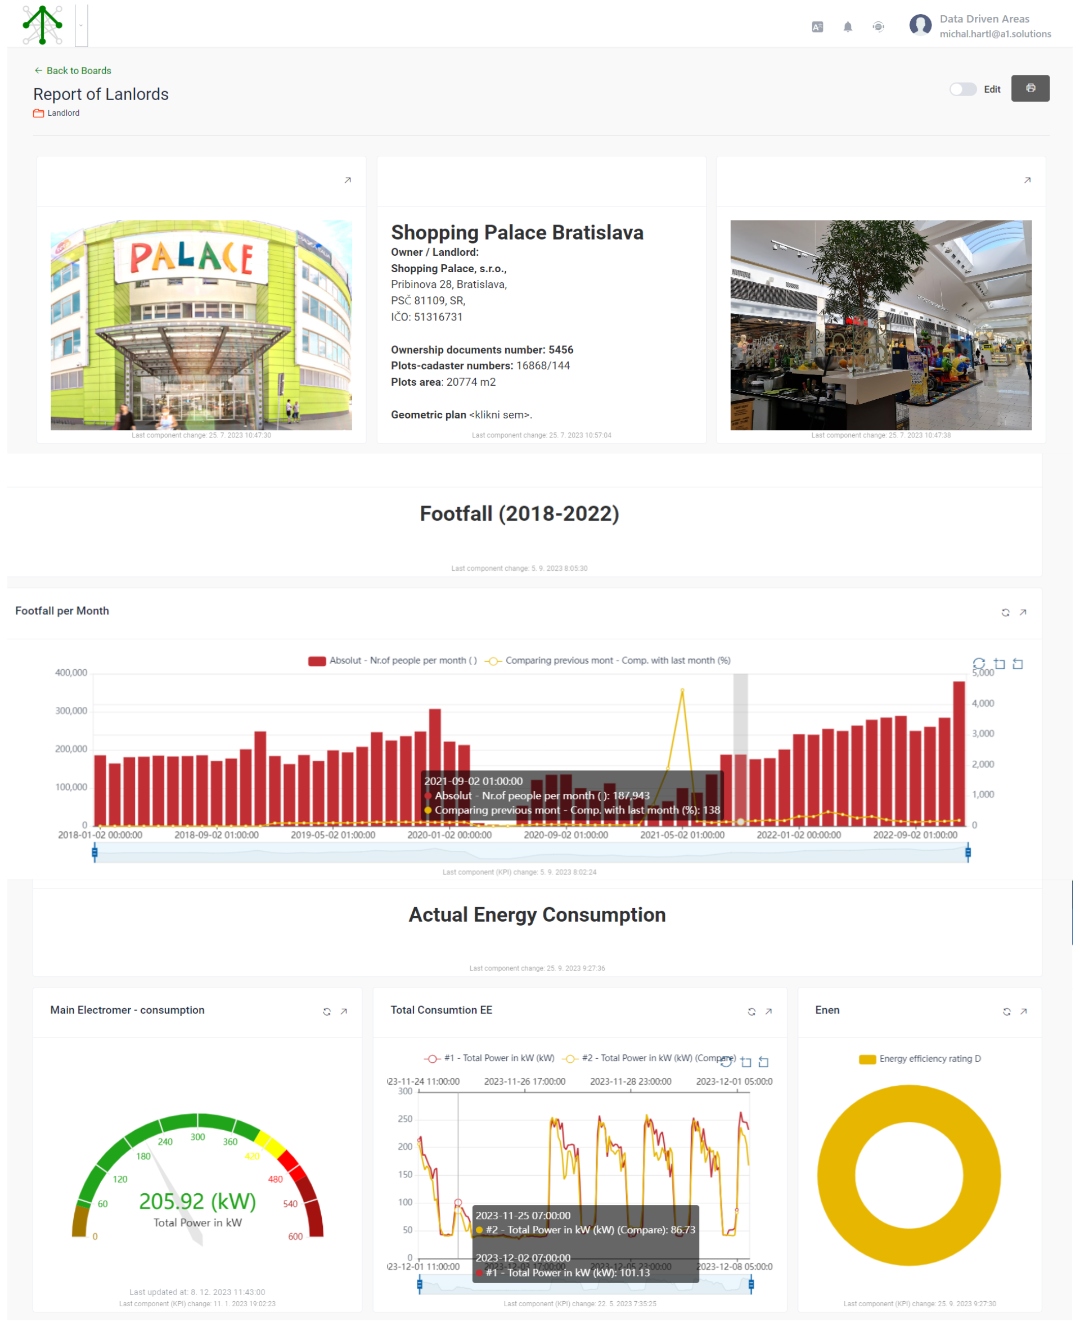
Footfall Analytics
+23% YoY Increase
Energy Consumption
Optimization -15%
Revenue Analysis
Above Benchmark
Our Approach: From Data to Value
We don't focus on features, but on results. Our goal is to provide you with the control and insight needed for strategic decisions.
Data Sovereignty
We will help you acquire, centralize, and manage all data about your portfolio. You will become the true owner of your digital assets, independent of external suppliers.
Process Automation
We will transform your manual and time-consuming processes, such as due diligence or reporting, into standardized, automated, and measurable operations.
Strategic Analysis
We will create valid sector benchmarks and analytical models for you. You will gain the tools for accurate budgeting, effective tendering, and continuous performance optimization.
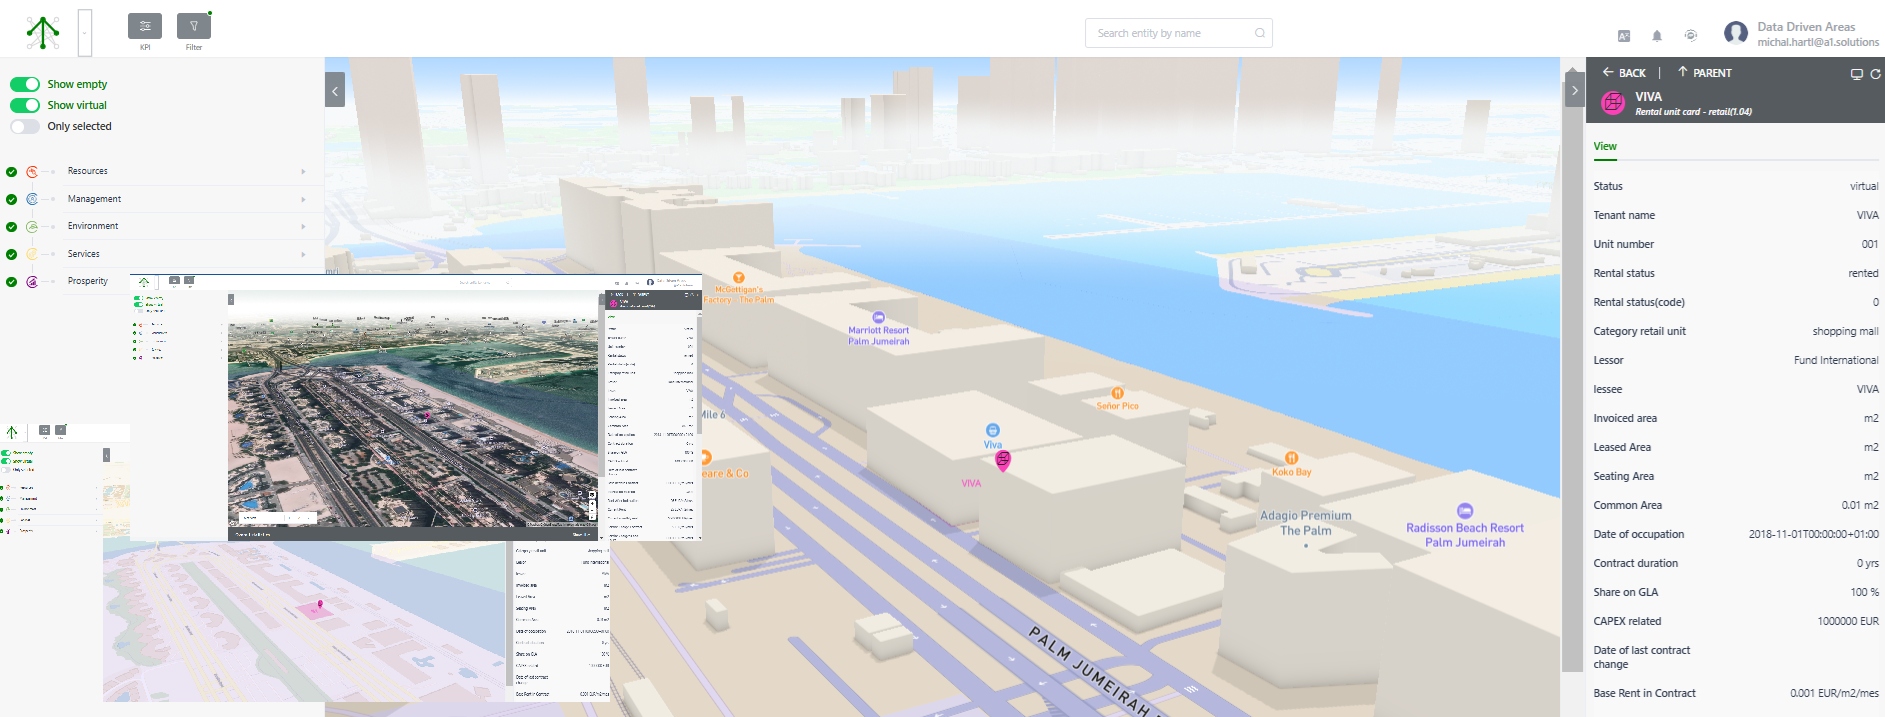
Key Insights
Portfolio Performance
Analysis of key metrics such as occupancy and average rent reveals a direct impact on the performance and financial health of the entire portfolio. The chart shows how these indicators evolve over time.
* Illustrative example — demo data for presentation purposes.
Portfolio Composition
Visualizing the portfolio composition by property type helps in managing risks and identifying areas with growth potential. You can see which assets form the main part of your property.
* Illustrative example — demo data for presentation purposes.
ESG & Sustainability
Tracking environmental, social, and governance (ESG) indicators is becoming an integral part of modern management. The radar chart compares your performance in key areas with the market average.
* Illustrative example — demo data for presentation purposes.
Return on Investment (ROI) Estimate
Predicting the return on investment is crucial when planning acquisitions and renovations. The horizontal bar chart compares the expected ROI of different projects, supporting informed decision-making.
* Illustrative example — demo data for presentation purposes.
Strategy
Why facilityUP?
A strategic tool for controlling value and reducing portfolio risk.
Roadmap Coming soon
The Future: DLT, smart contracts & the Digital Building Passport
A planned extension beyond today's product.
From a unified data twin to a trusted data infrastructure
Once data is clean and structured, the next step is to anchor it immutably.
A roadmap, not a commitment.
The Result: A Change That Starts with You
This service offers more than just tools. It initiates the transformation of real estate professionals into sovereign masters of their data and portfolio. The result is your transformation from a reactive manager to a proactive value architect, with full control over every phase of the property lifecycle.
What are we currently working on?
We have initiated the process of integrating BIM (Building Information Modeling) into the platform environment, and we have also started preparing the environment for the integration of so-called "smart contracts" built on DLT (Distributed Ledger Technology), which fundamentally changes data management by using decentralized networks to increase security, transparency, and efficiency.